Self-organizing maps explained
The self-organizing map (SOM) is like a brain that has learned the musical pieces of a collection. The ESRA SOM in ESRA is trained on all pieces in ESRA. You can train your own SOM in the offline version.
Online, there are two trained SOMs, one for timbre and one for rhythm (for details about the features, see sections of this manual). Pitch extraction robustly only works for single-line melodies. As the collection at this stage has not enough single-line melodies in all collections extracting and learning tonal systems, melodies, or melisma is left to the offline version. Below, on the very left top menu ‘SOM Timbre Track u-Matrix’ is displayed:
A trained SOM consists of neurons in a two-dimensional field. Each neuron is a vector of all features used for training, timbre, or rhythm features. Neigbhouring neurons might be more or less similar. This similarity is displayed in the u-matrix, where similar regions appear dark blue and blue, and more dissimilar regions appear green or yellow. Therefore we know that pieces in a dark blue region are very similar to one another, while pieces separated by a lighter ridge are more dissimilar.
The trained SOM is then used to place musical pieces on it, where each piece is placed at the neuron, which is most similar to this piece. Therefore, the trained SOM can be used to analyze pieces the map was not trained by, so e.g., new uploaded pieces from users.
The training set, here the ESRA pieces allow sorting pieces according to the musical content in this collection. Therefore the SOM is like a person knowing all these songs, but no others. For analysis of other musical styles or regions, the training of a new map might be considered. This can be performed in the offline version.
Therefore, the similarity or dissimilarity of a piece is a combination of two factors: a) the distance on the map between the two pieces and b) the coloring between the two pieces.
Exploring the map in terms of analyzing musical pieces in the online version is therefore done by exploring neighboring pieces. This can be done in several ways:
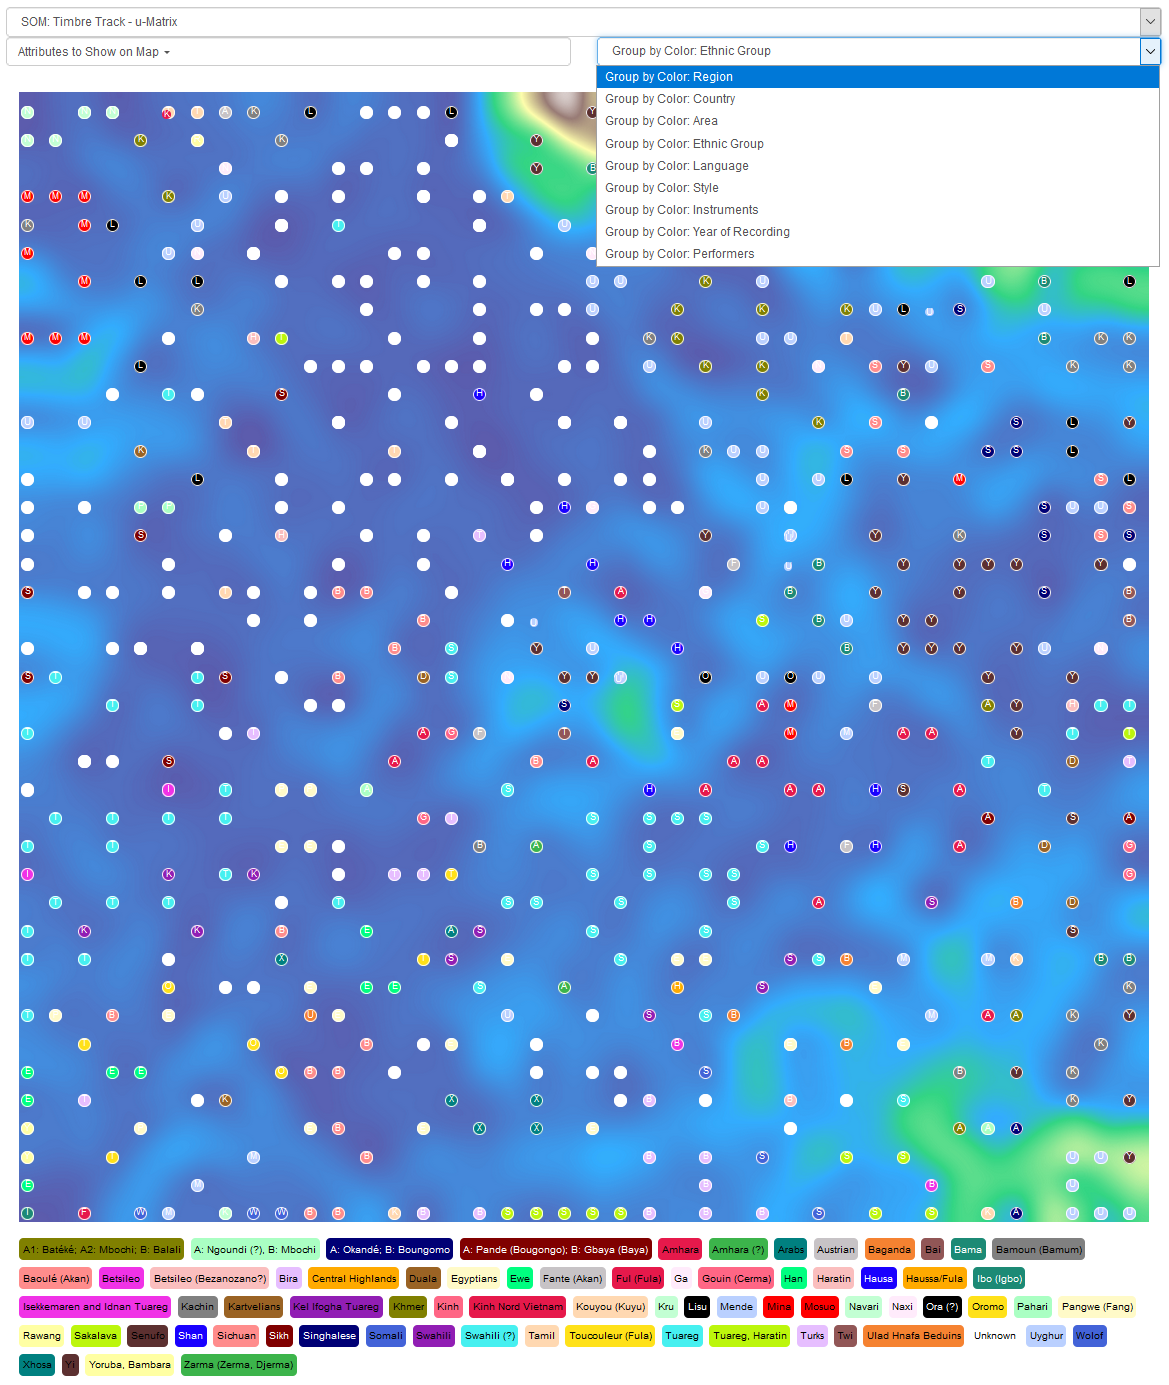
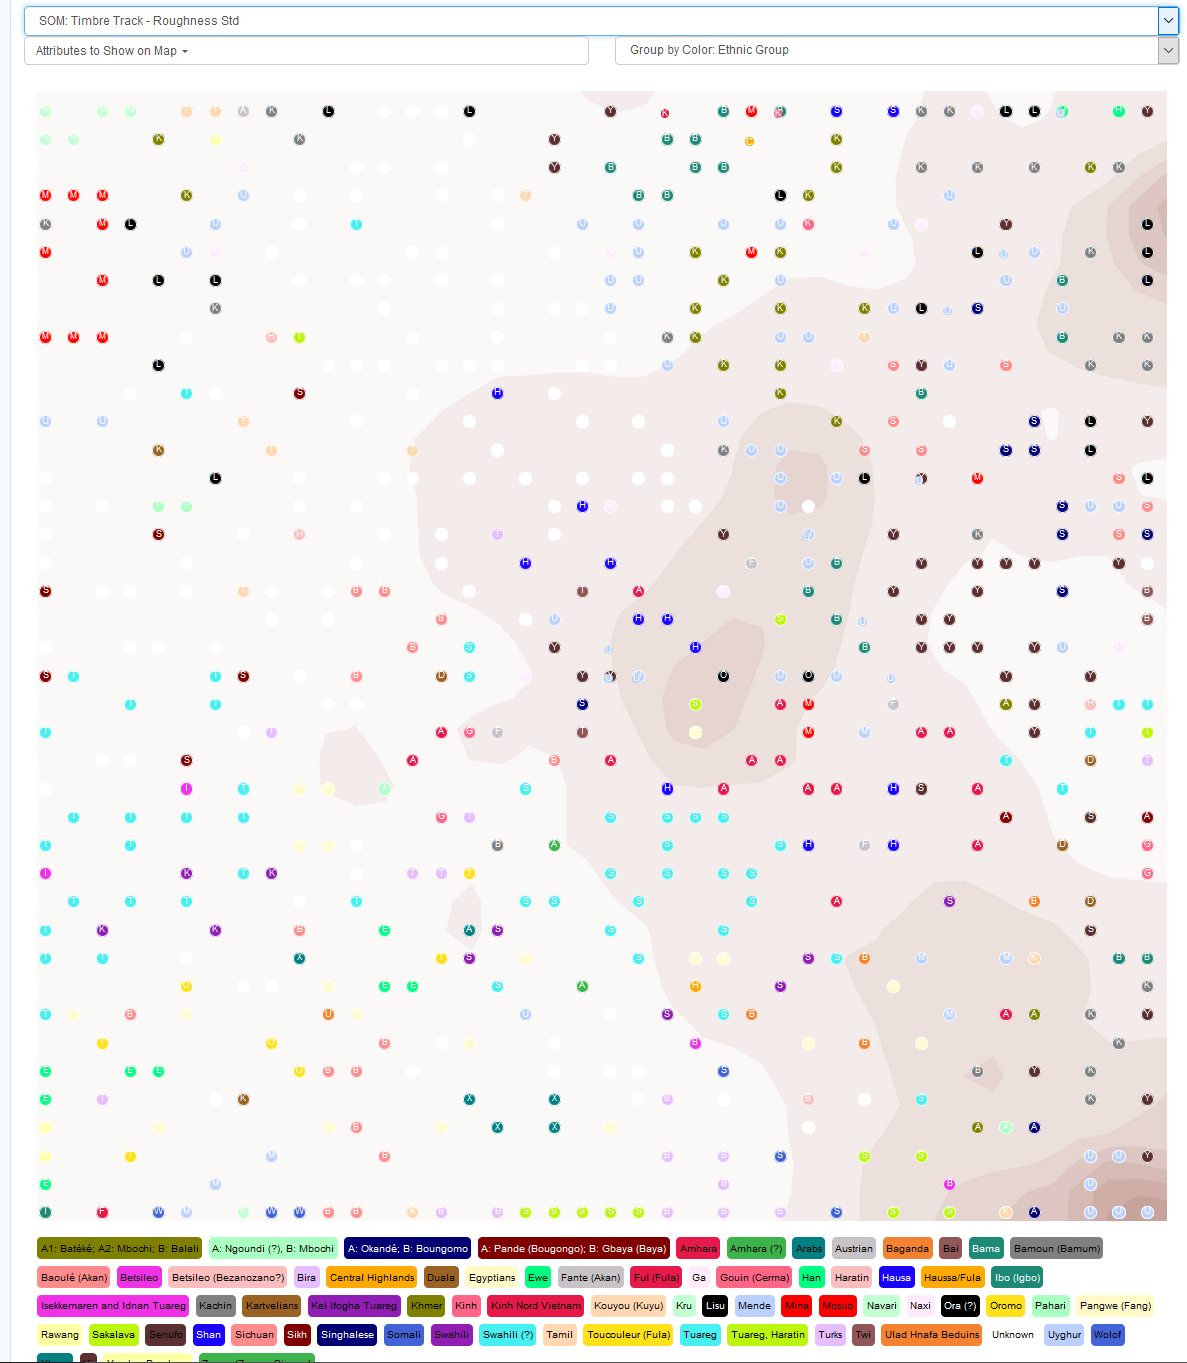
In the figure above, the pieces have colors according to ethnic groups, which is displayed at the menu entry on the top right. At the bottom of the plot, a legend shows the association between ethnic groups and color. The pop-up menu shows additional metadata. Choosing one of them changes the legend and the coloring of the pieces, respectively.
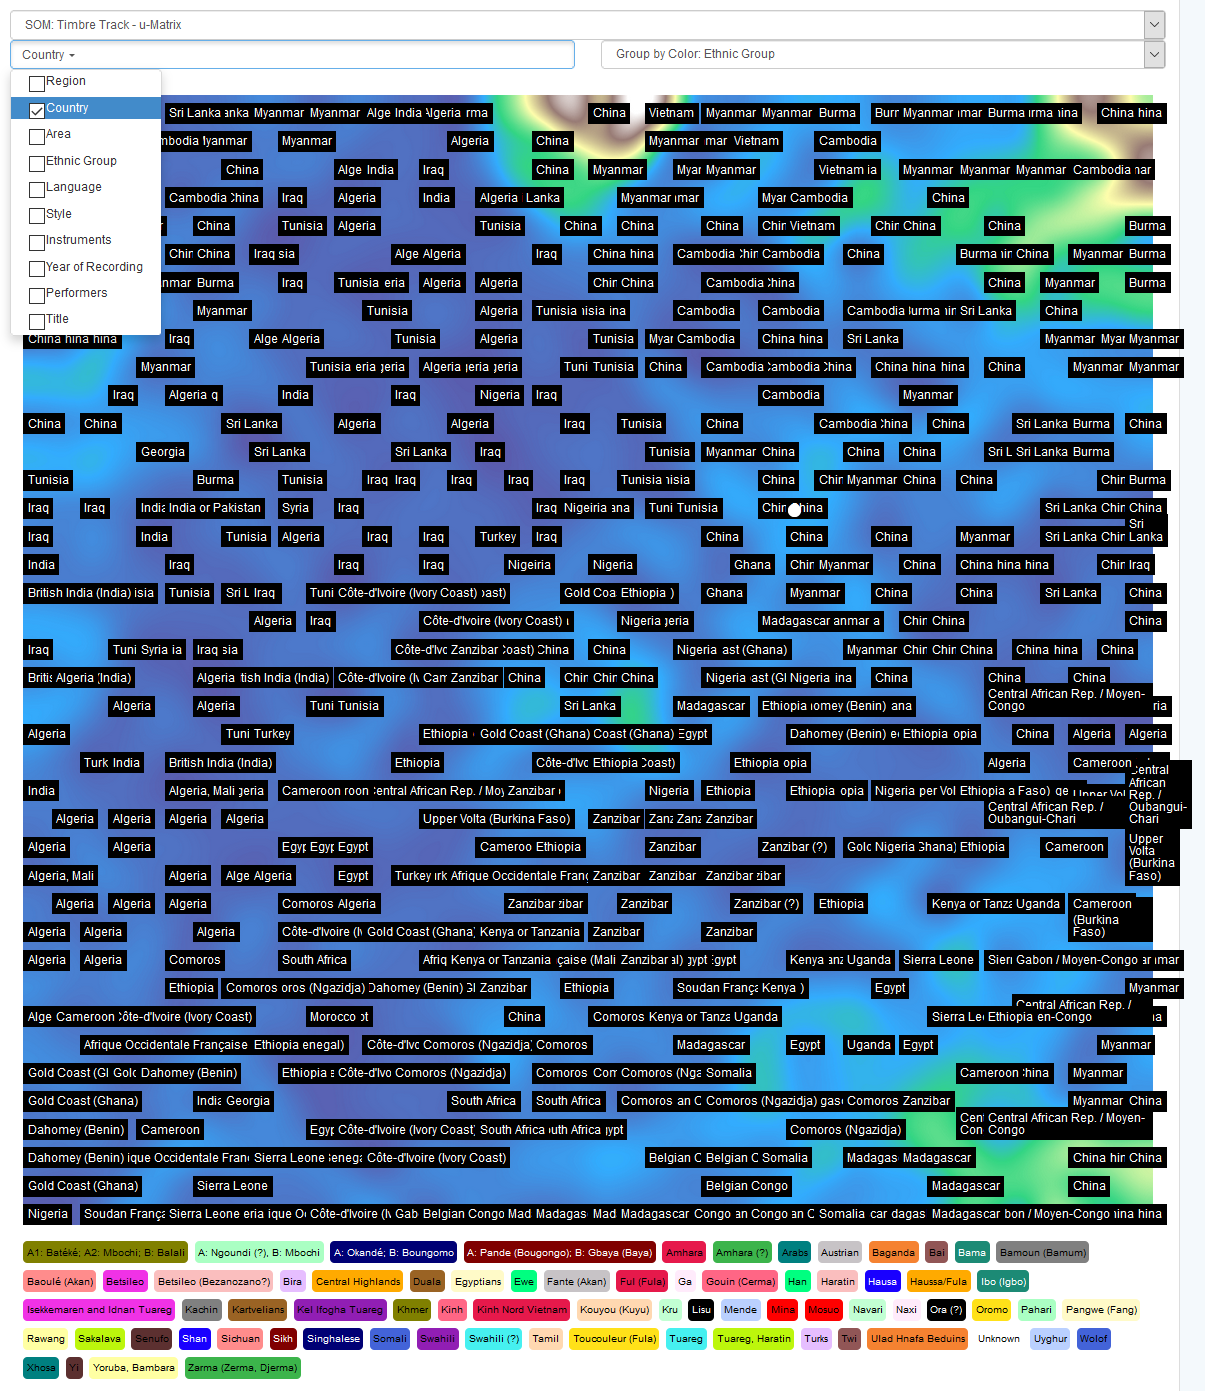
Another way of analyzing similarities is to display one or several metadata in the map. The top left menu allows several metadata to be used, also simultaneously. Be careful with this, the map might become too crowded:
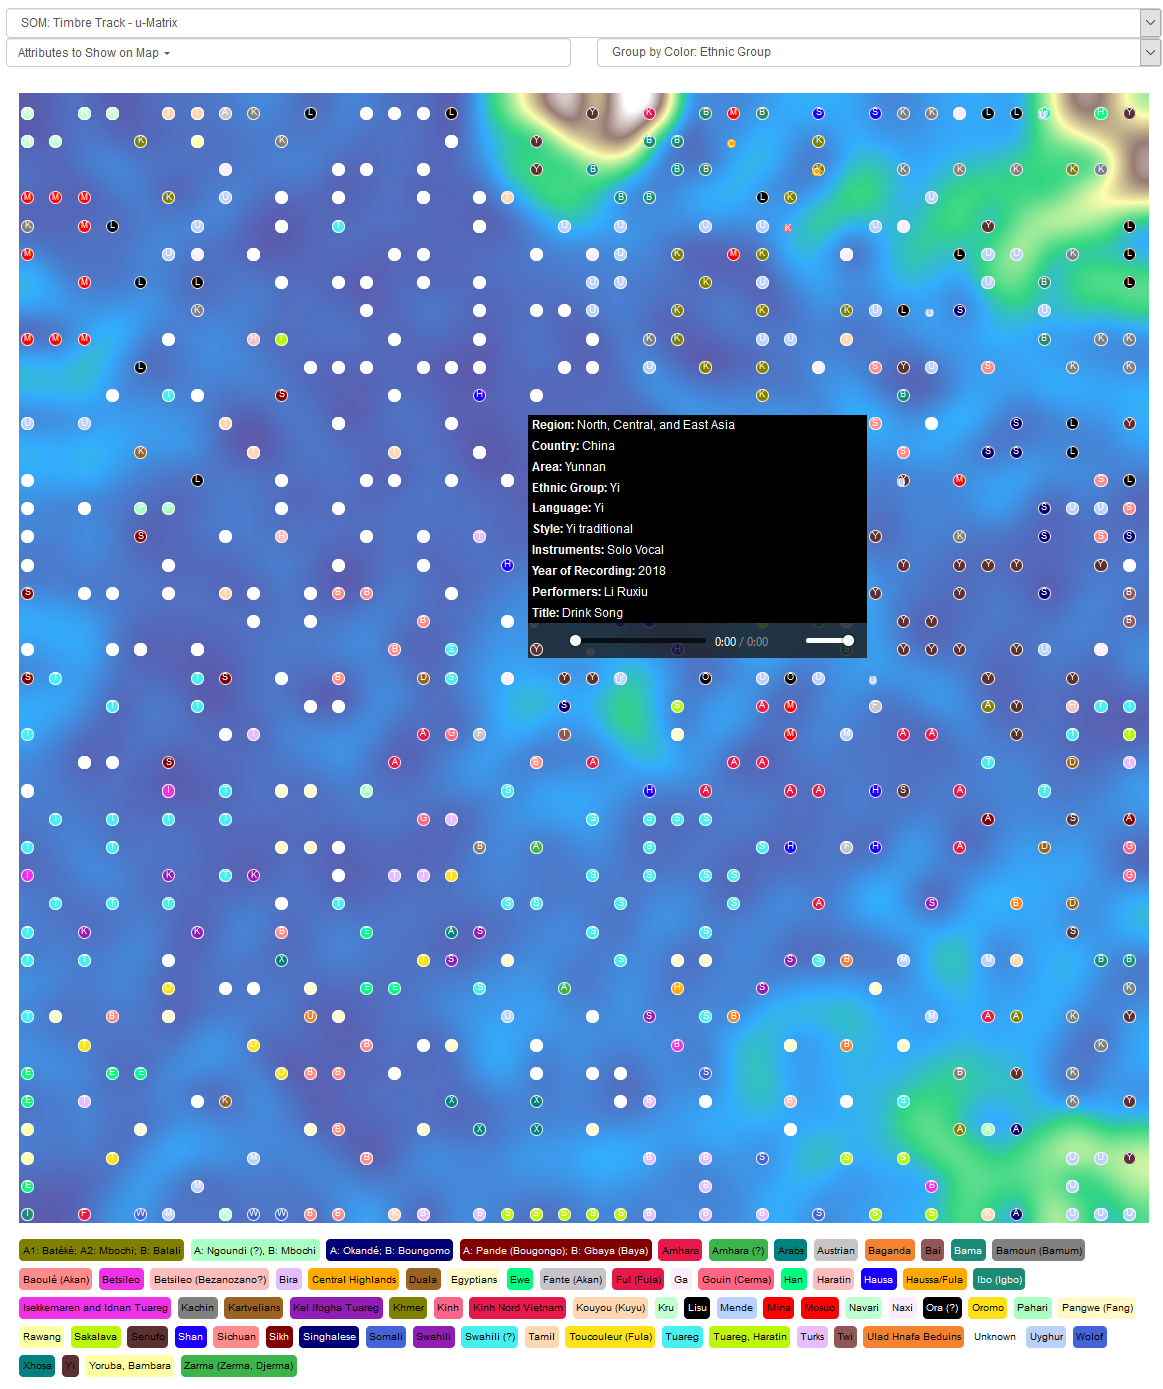
Yet another way is to look at the metadata of single pieces on the map. Moving the cursor over the map to a piece, the metadata of this piece pops up. Additionally, a player is shown, which allows instantaneous playback of this special song. It is very interesting to listen to neighboring pieces in this way, to hear if the analyzed feature of this piece fits aural perception.
A fourth way of analyzing is to understand why the pieces are located in the map the way they are. Below examples of timbre are shown, rhythm is accordingly.
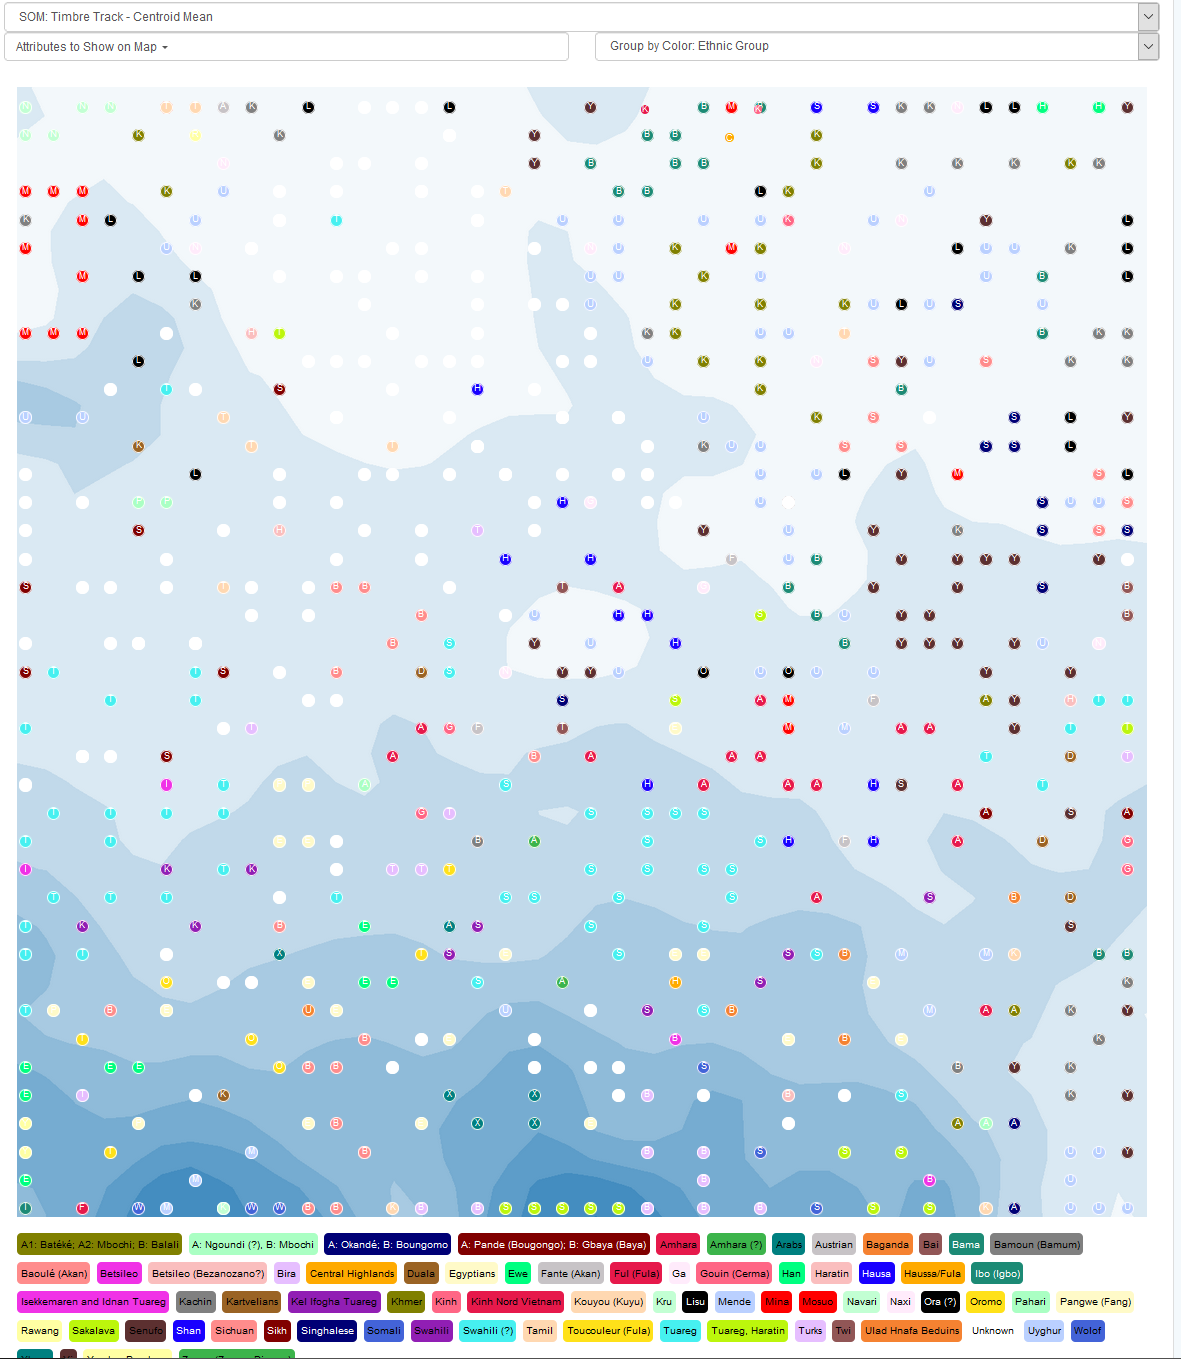
In the figure above, the top left menu displays ‘SOM Timbre Track - Centroid Mean’. Then only the background image changes. In this case, it displays the strength of the spectral centroid, the perceived brightness of the songs. The lower end of the two-dimensional plot shows dark blue regions. This means the centroid is much higher than in the other regions. Therefore, pieces placed here are much brighter, always compared to all other pieces on the map.
Another example below shows the standard deviation of roughness. This is achieved by changing the menu entry on the very left top. The pieces located on the right side have a much higher roughness standard deviation compared to the other pieces. This does not mean that they are rougher, it does mean that roughness over the course of the piece does change. The piece might be very rough at some point and very soft at another.
Combining all analysis tools allows for understanding similarities, dissimilarities, clustering, etc., of musical pieces in the collections and in songs uploaded by users. Basically, either one is looking for clustering in existing data, or one allows for exploring the pieces in terms of the analysis tools to start hearing similarities one might not be aware of before.